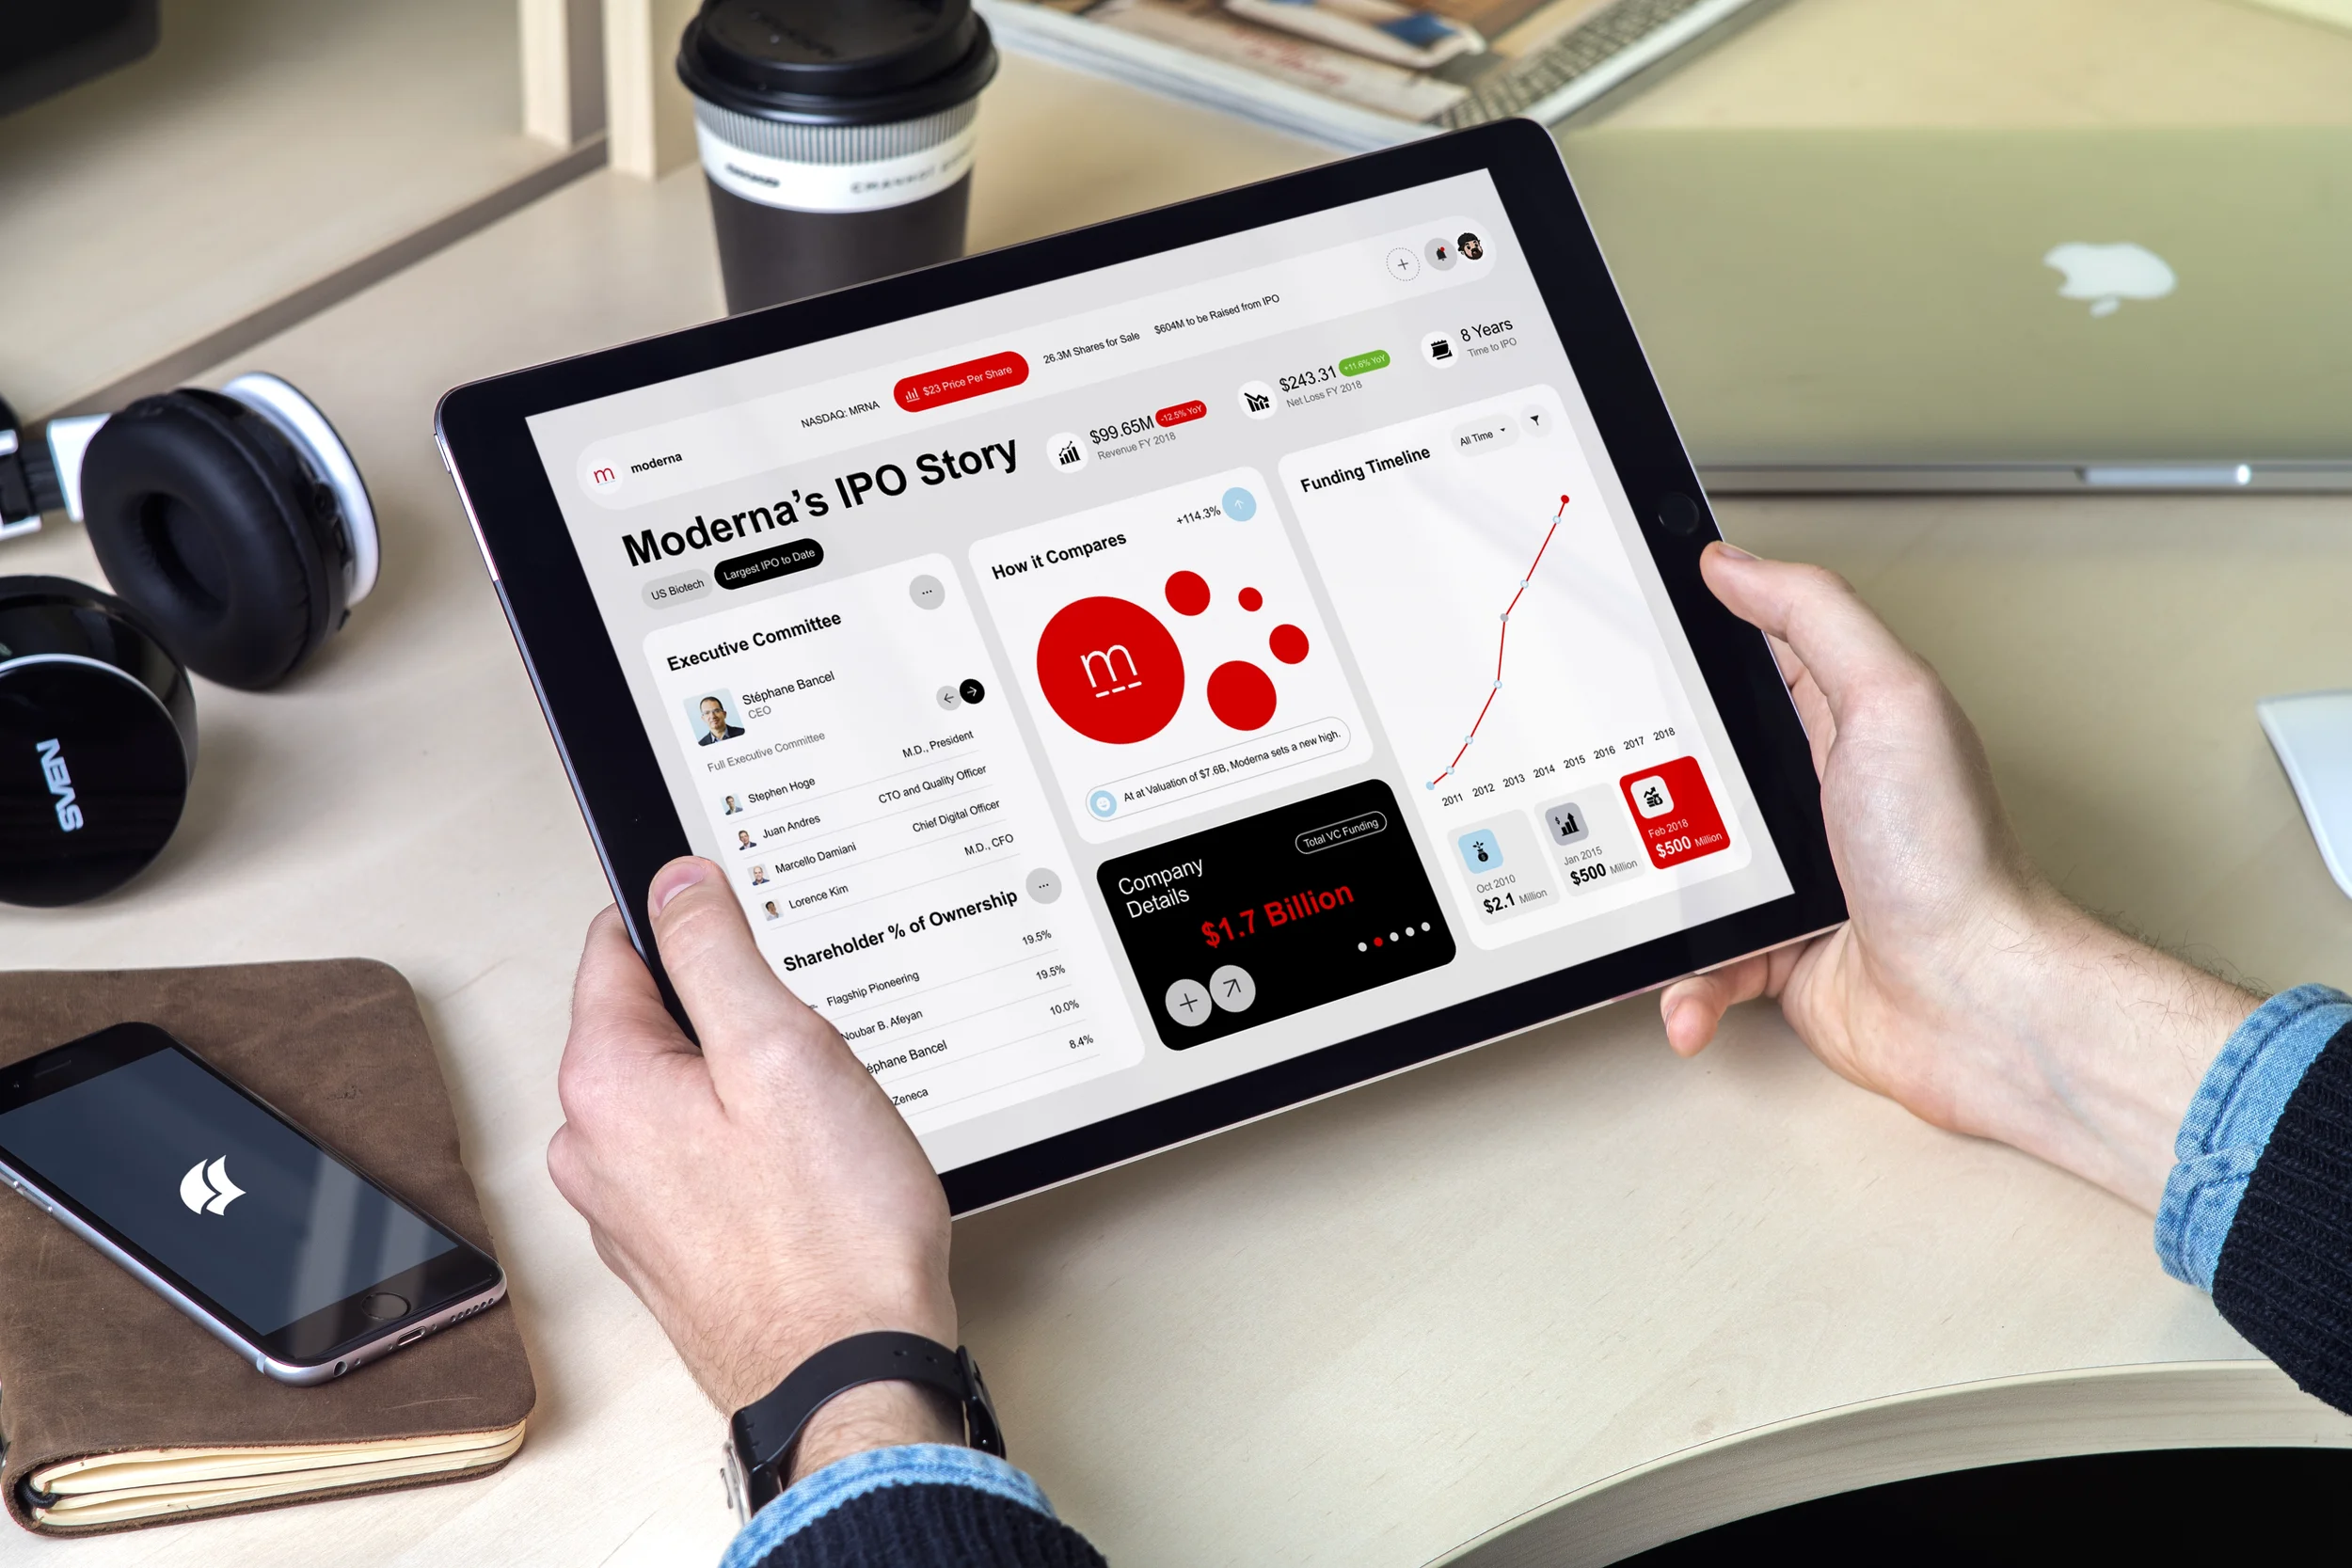
Designing clear data stories for PitchBook users, I shaped interfaces, charts, and systems that turned complex market info into calm, trusted experiences.
I helped teams move fast, make decisions, and feel confident displaying financial information and findings into easy to digest content every day.
Layout and Reporting on Financial Data
Roles and Responsibilities
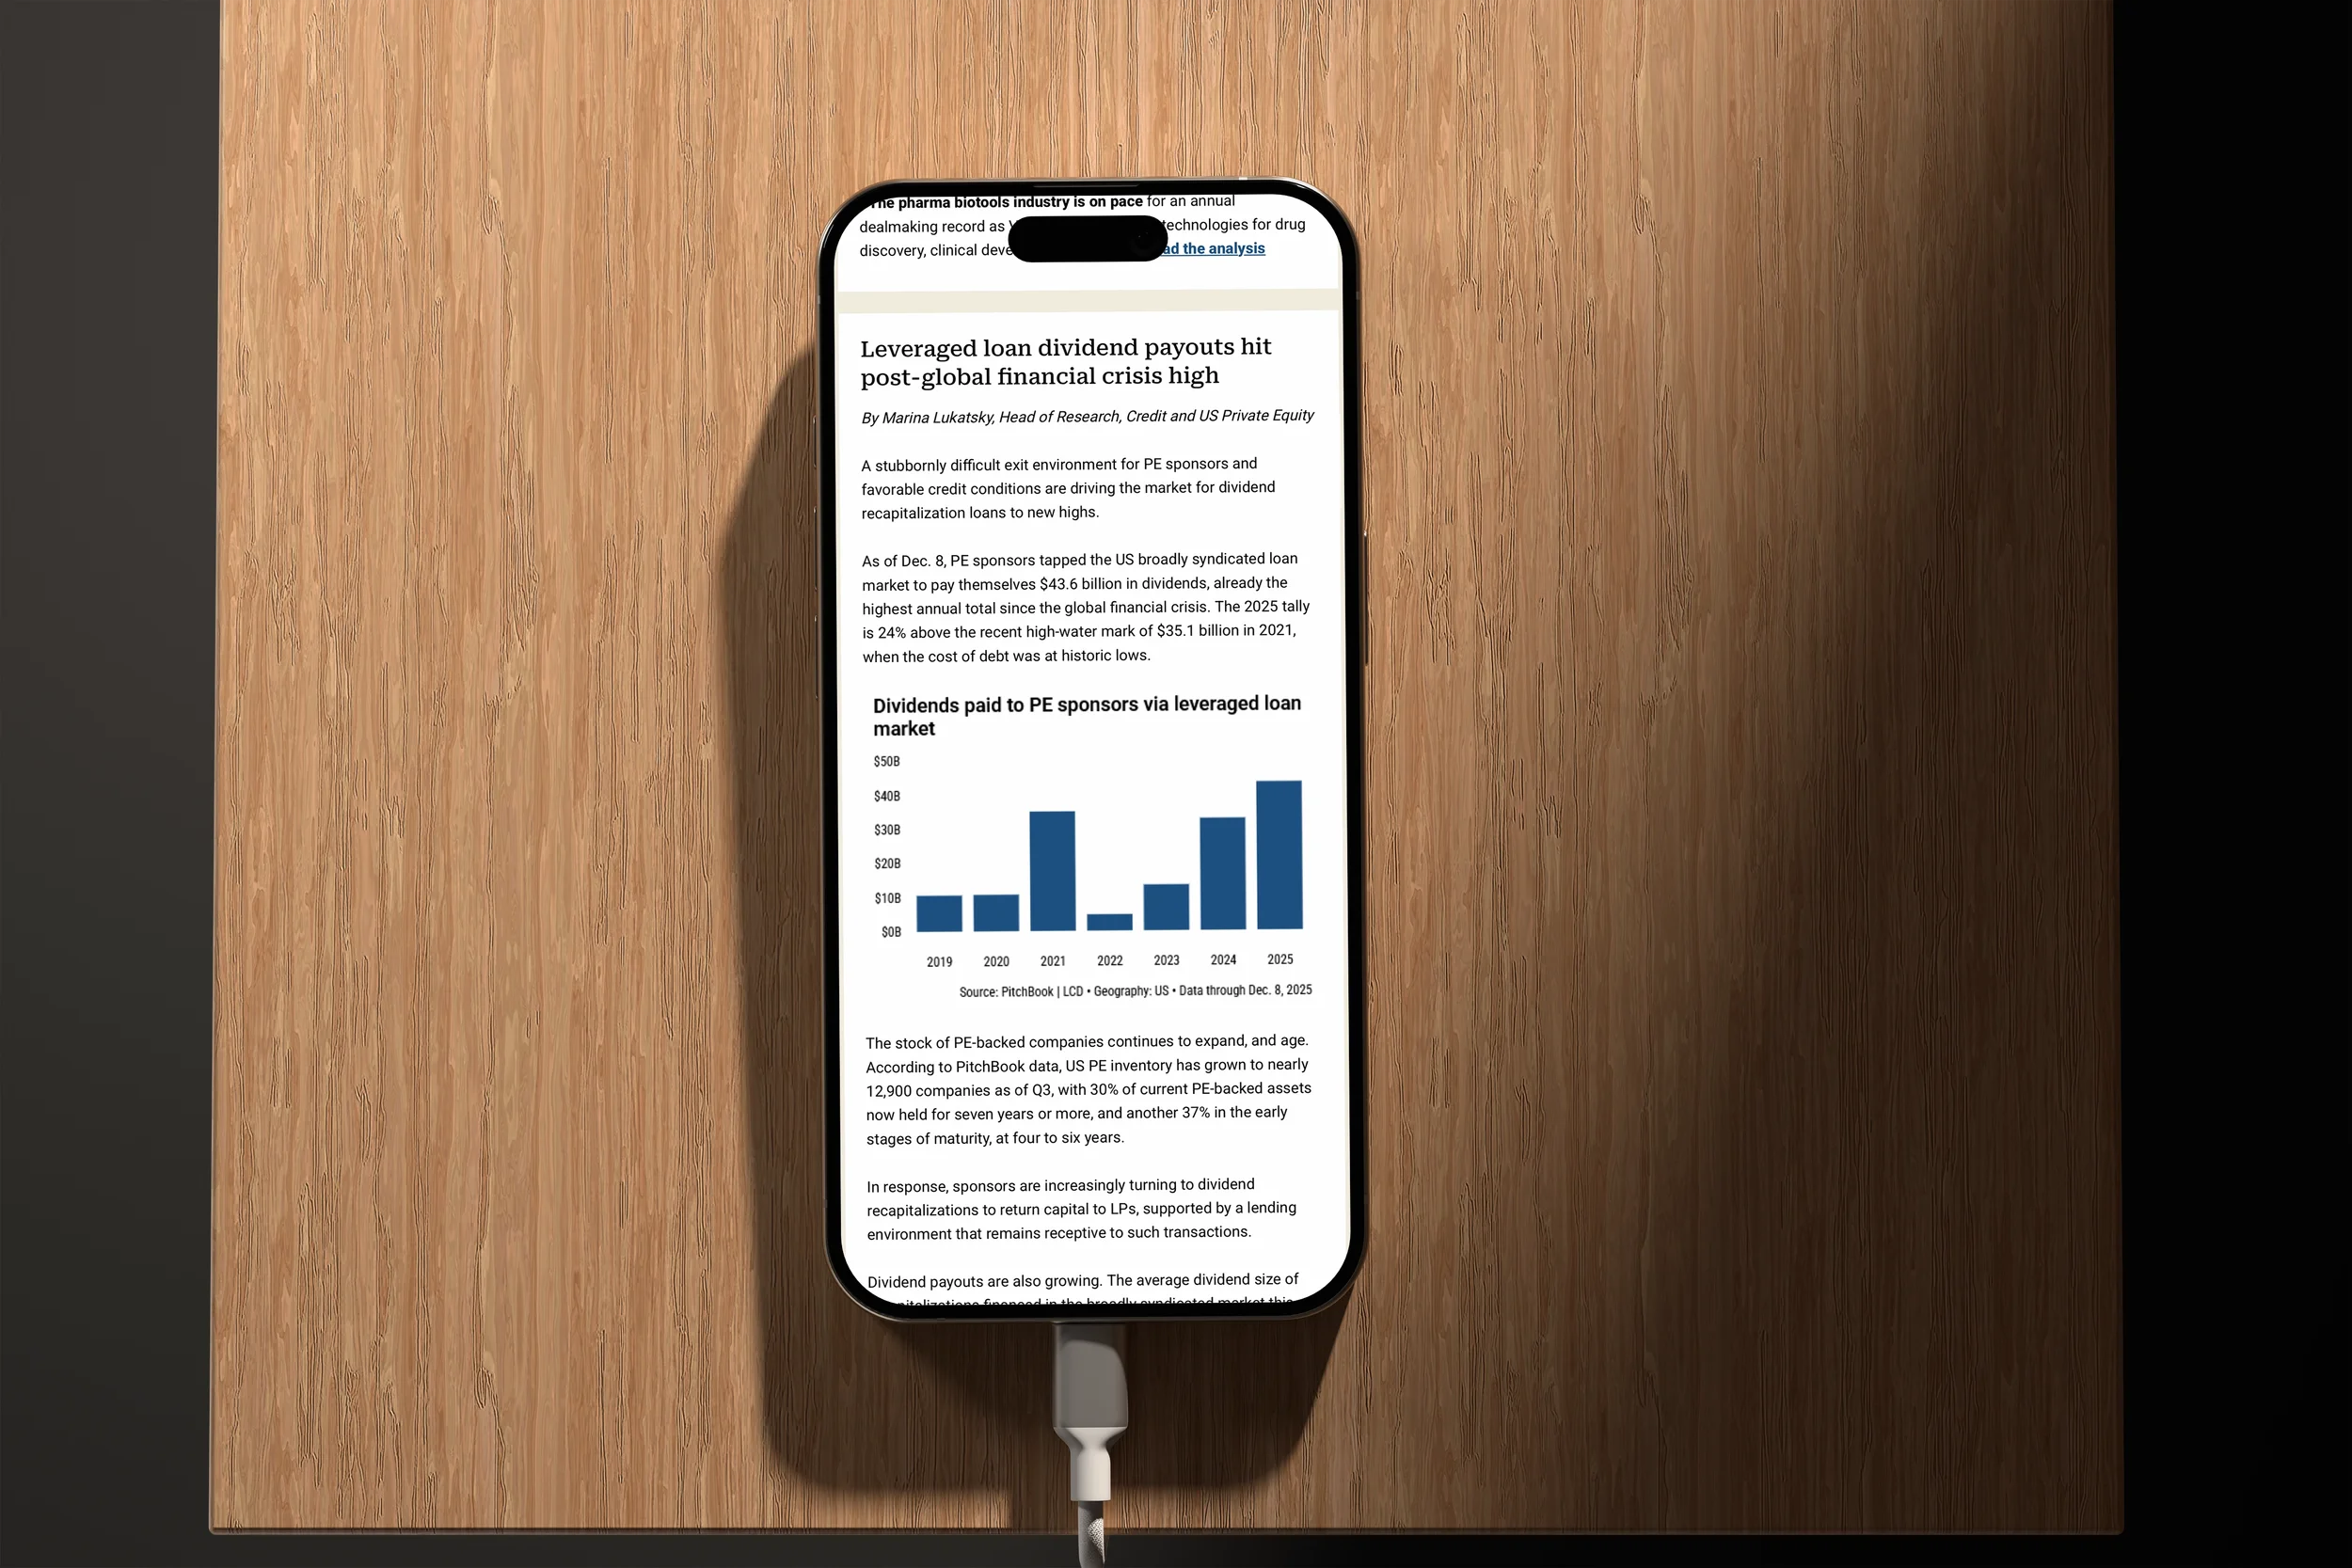
I primarily sat on the editorial team. My design works encompassed support for a daily newsletter with over 100,000 active readers, in-house reports that were staple content on the yearly calendars, as well as acted as the go-to cobranding designer for white paper projects for many of our financial institutional partners.
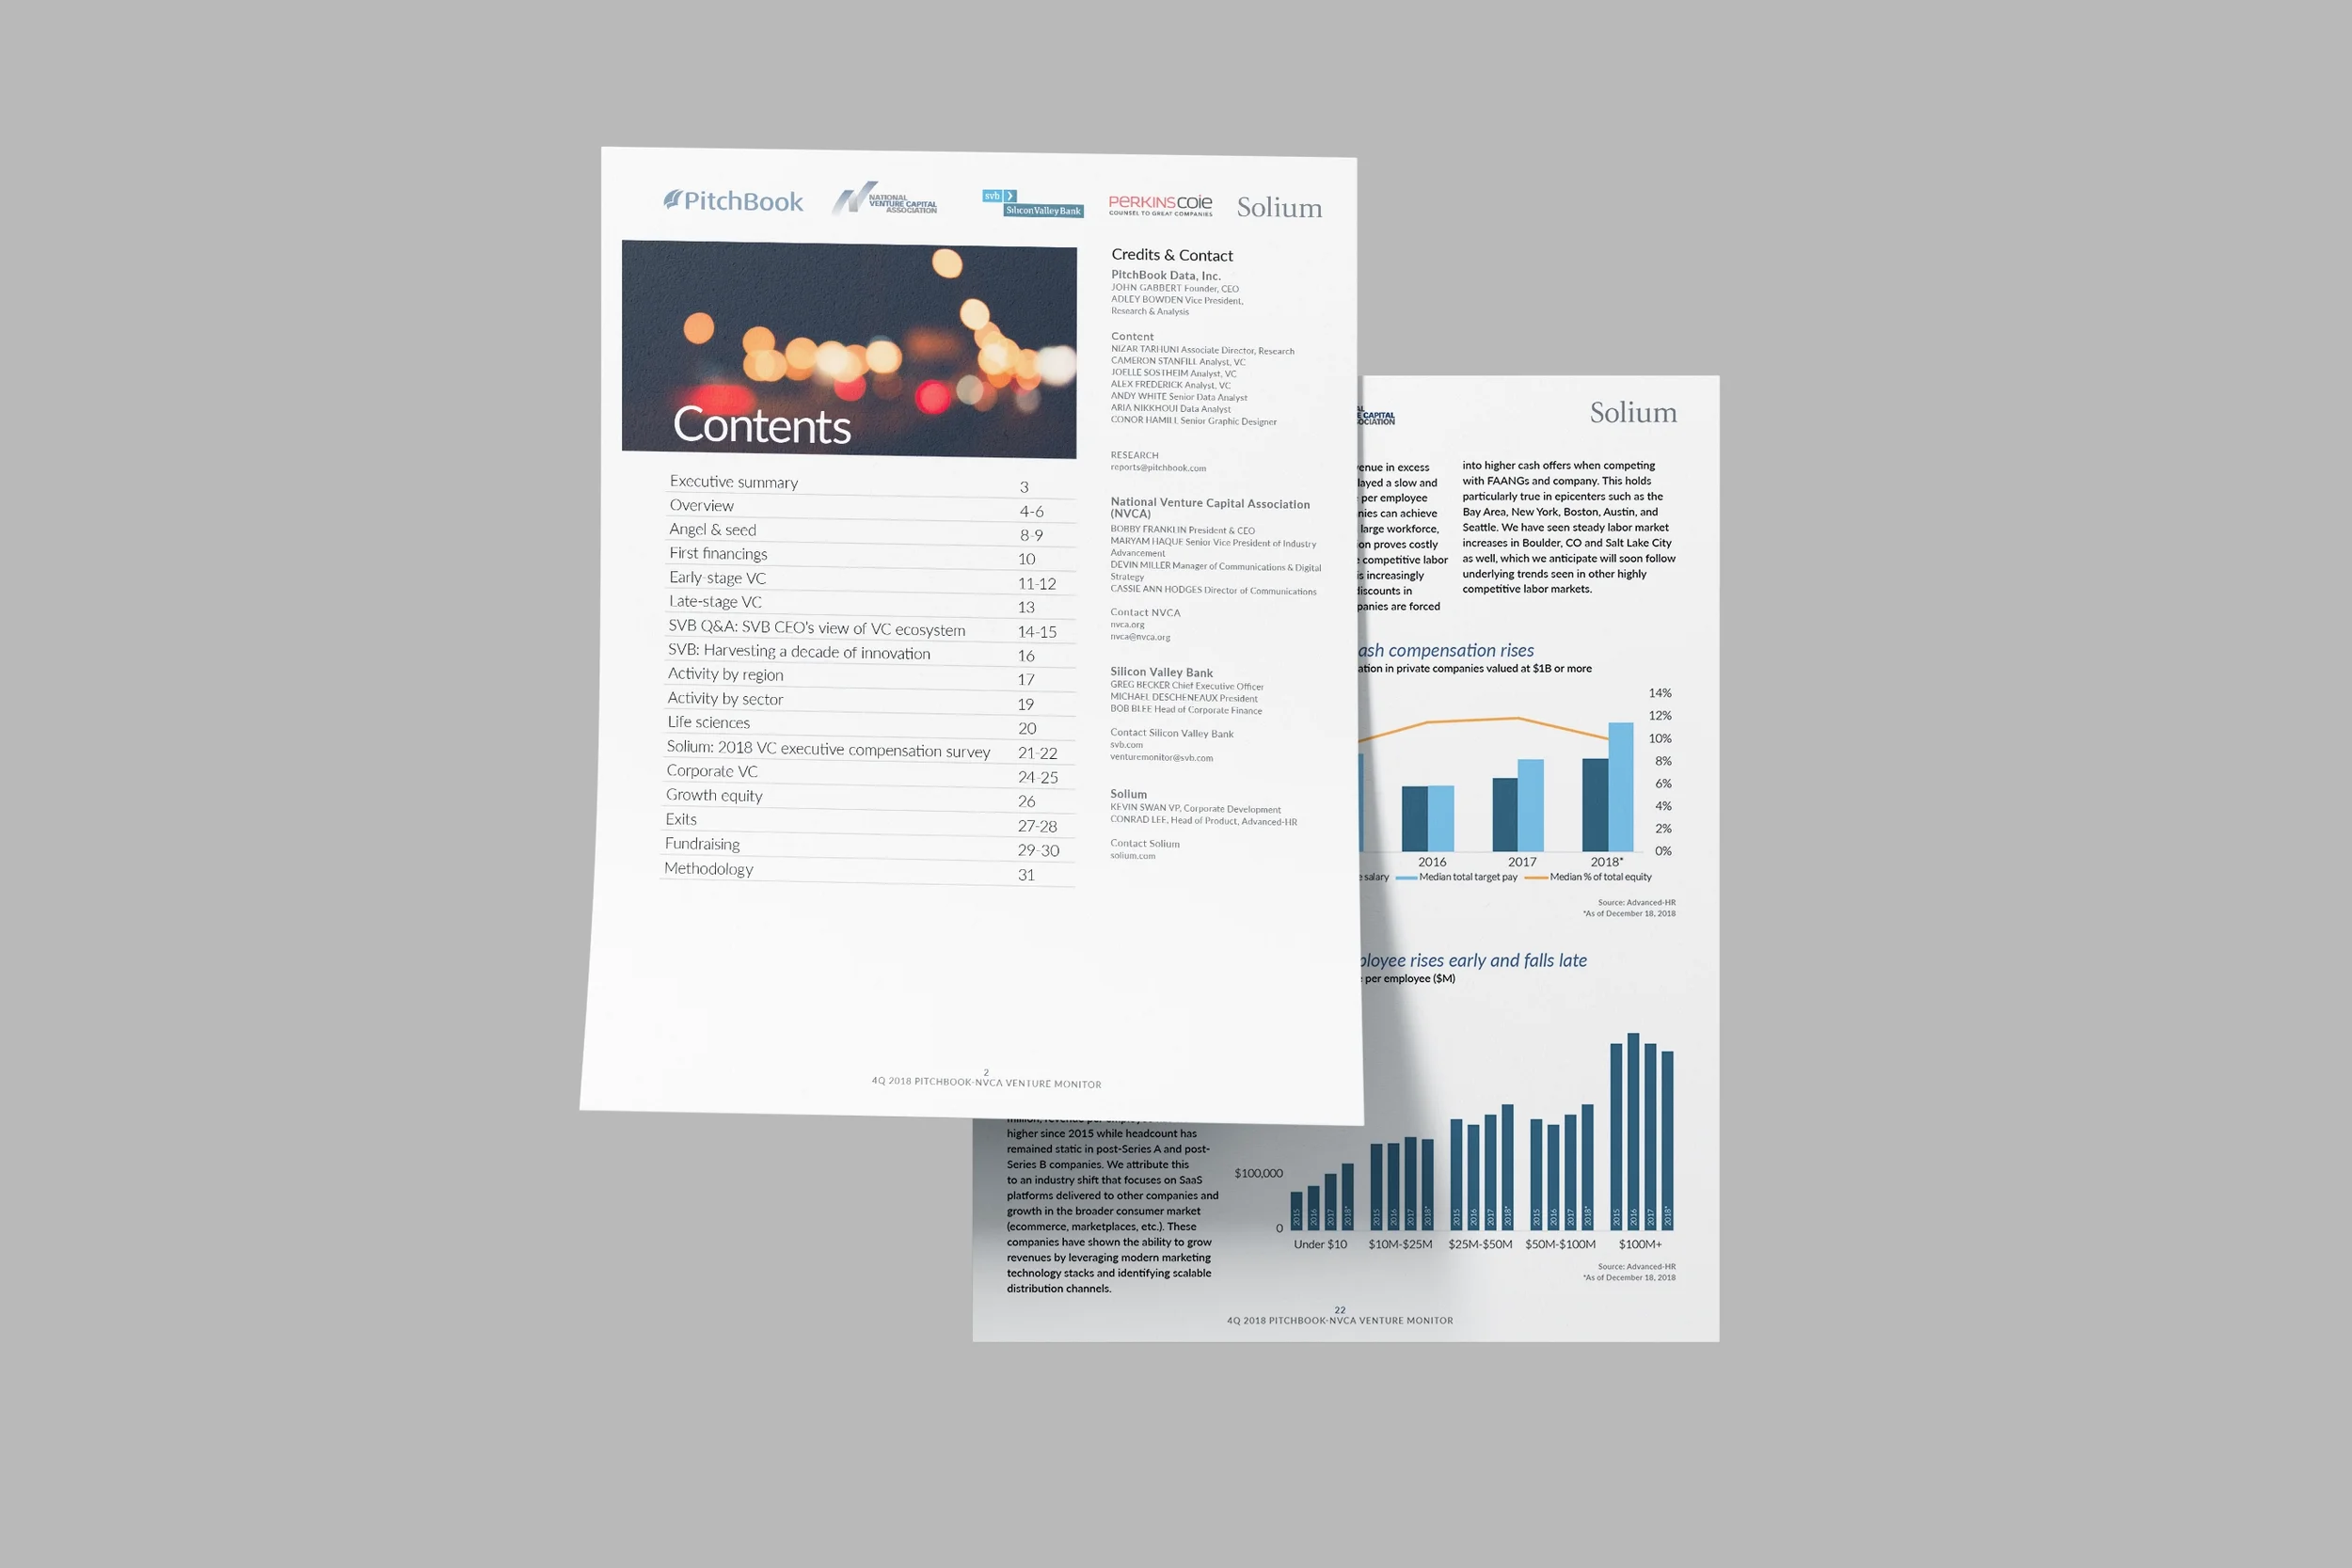
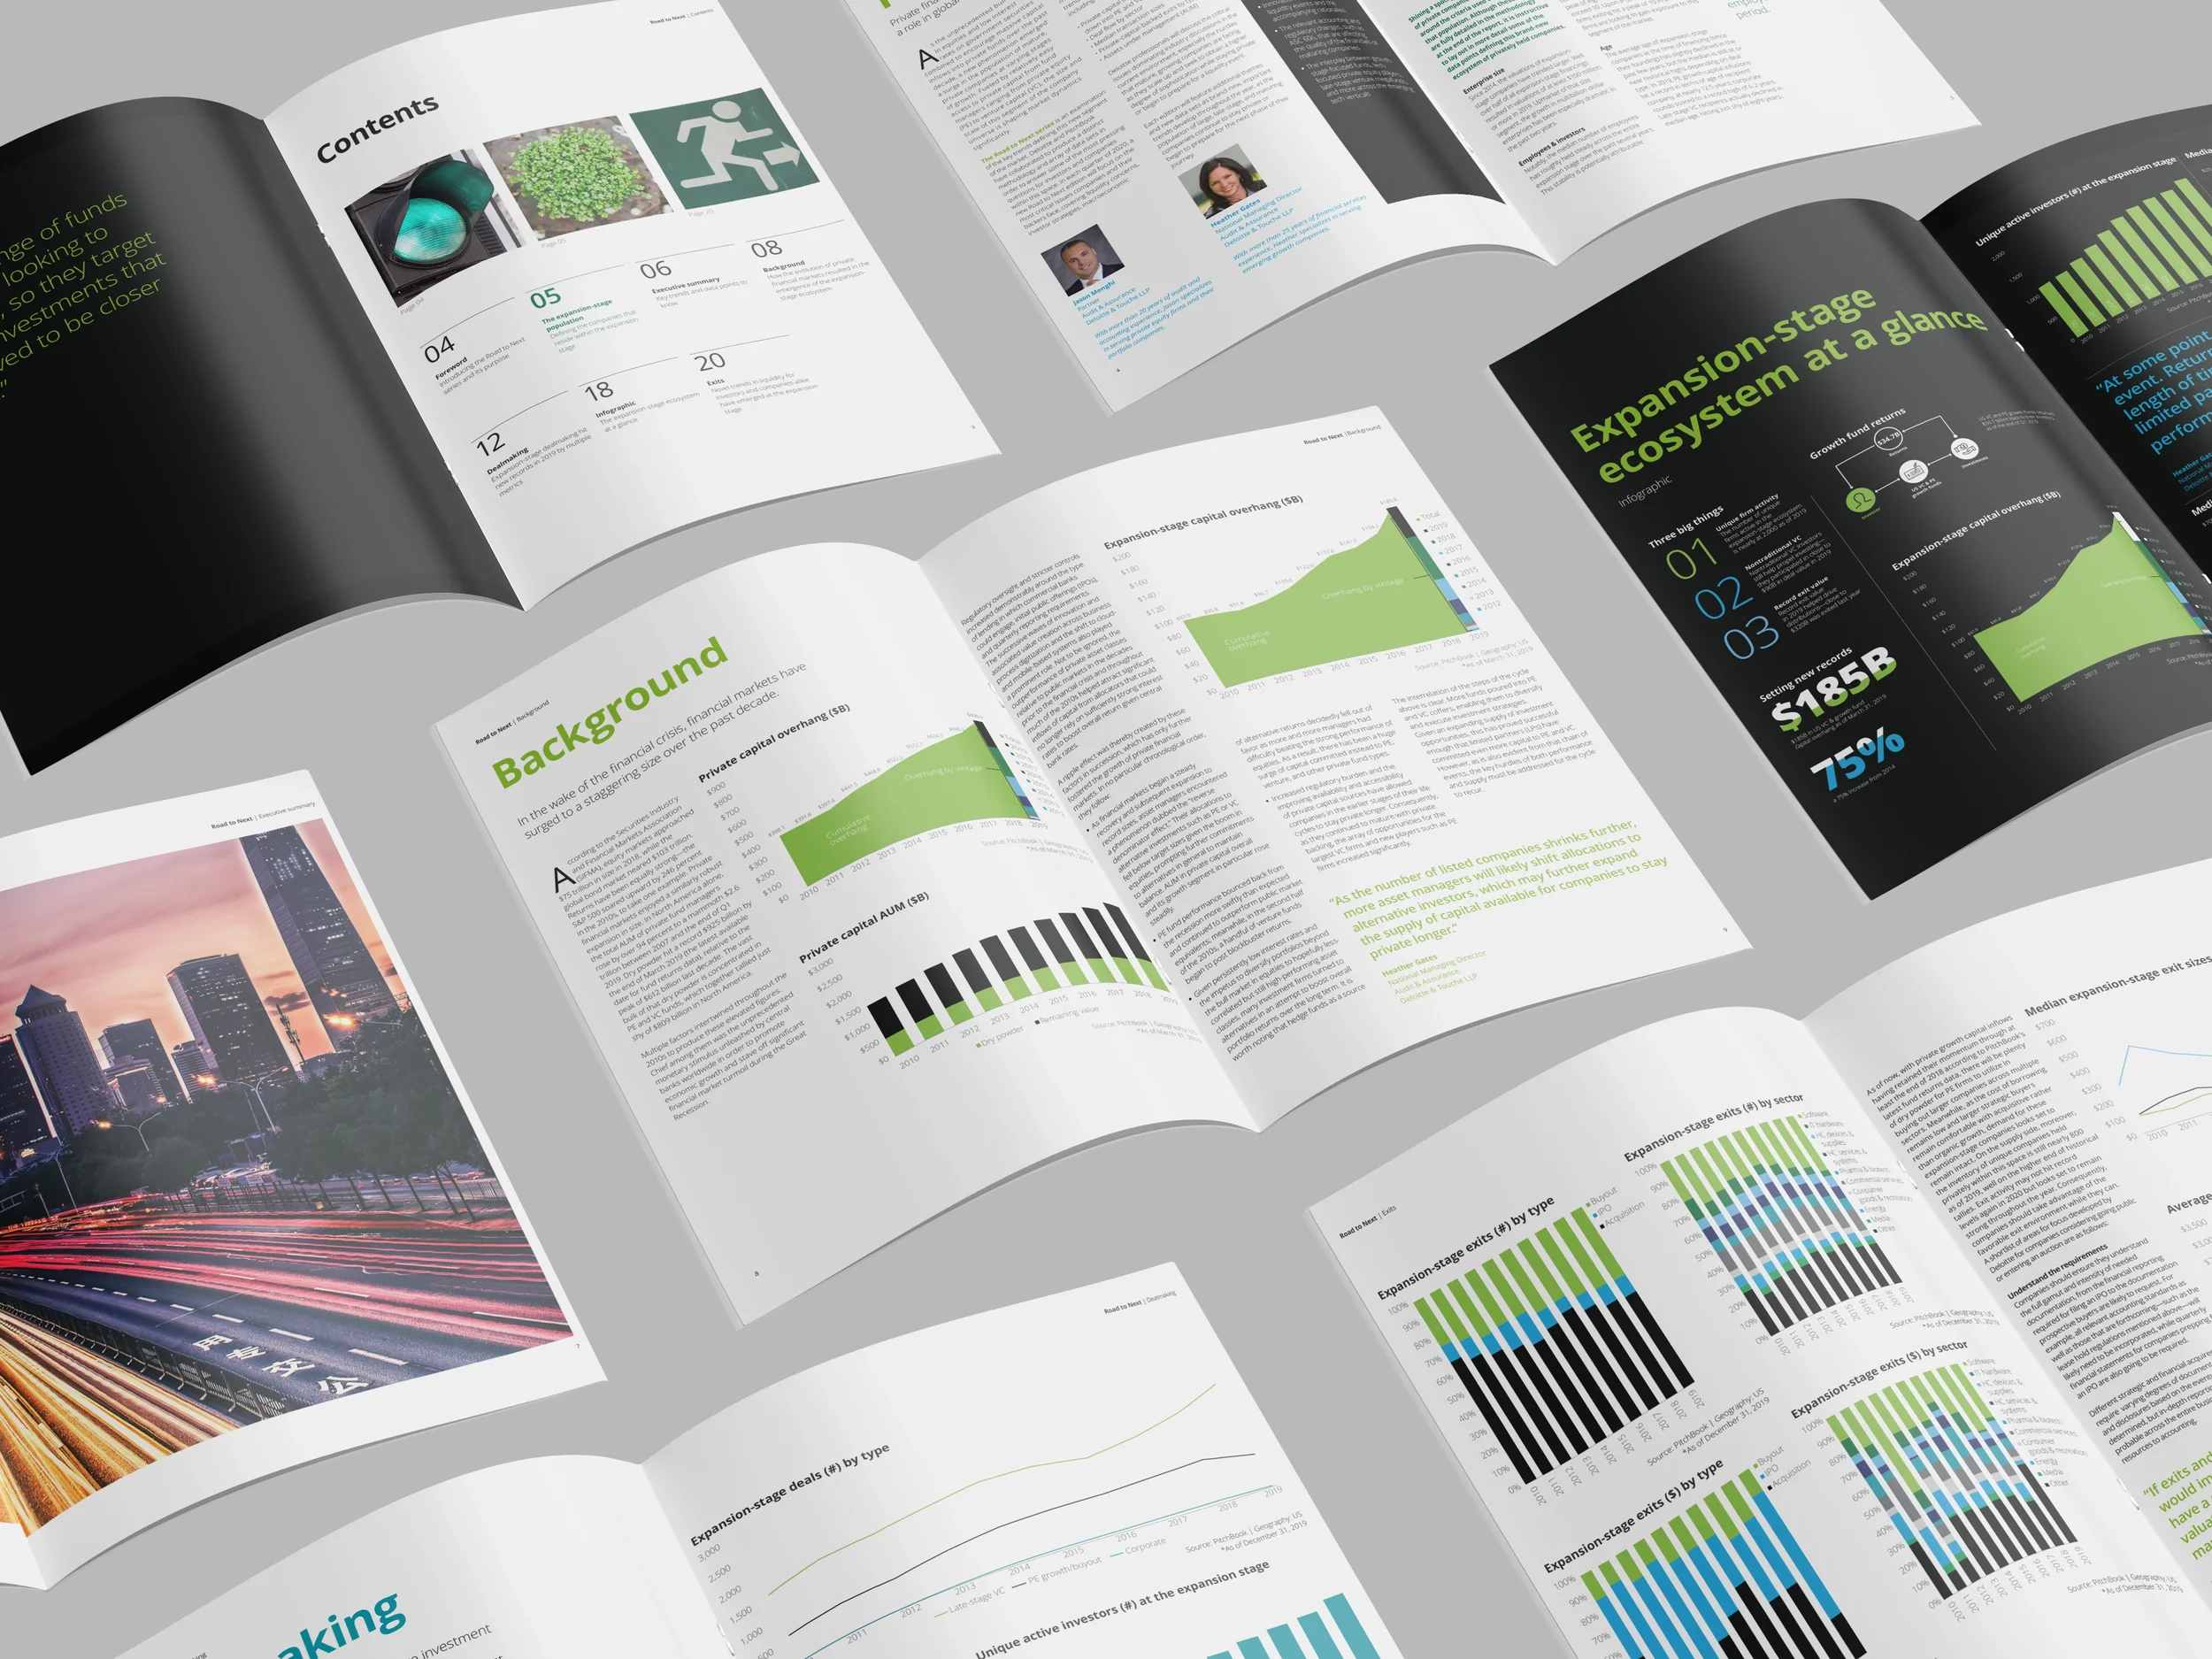
Reports
I oftentimes leaned into my natural minimalist design tendencies. So often less is more when presenting data, and you just want your readers to “get it”. Clients could easily find what they were looking for.
Infographics
I translated dense market data, valuations, and trend analysis into clear visual stories. The work focused on accuracy first, making sure every chart and callout aligned with verified numbers while still being easy to scan. Many of these visuals supported reports, presentations, and internal analysis where clarity and trust mattered more than flash. The end result helped teams and clients grasp what was happening in the data without needing to sift through spreadsheets.
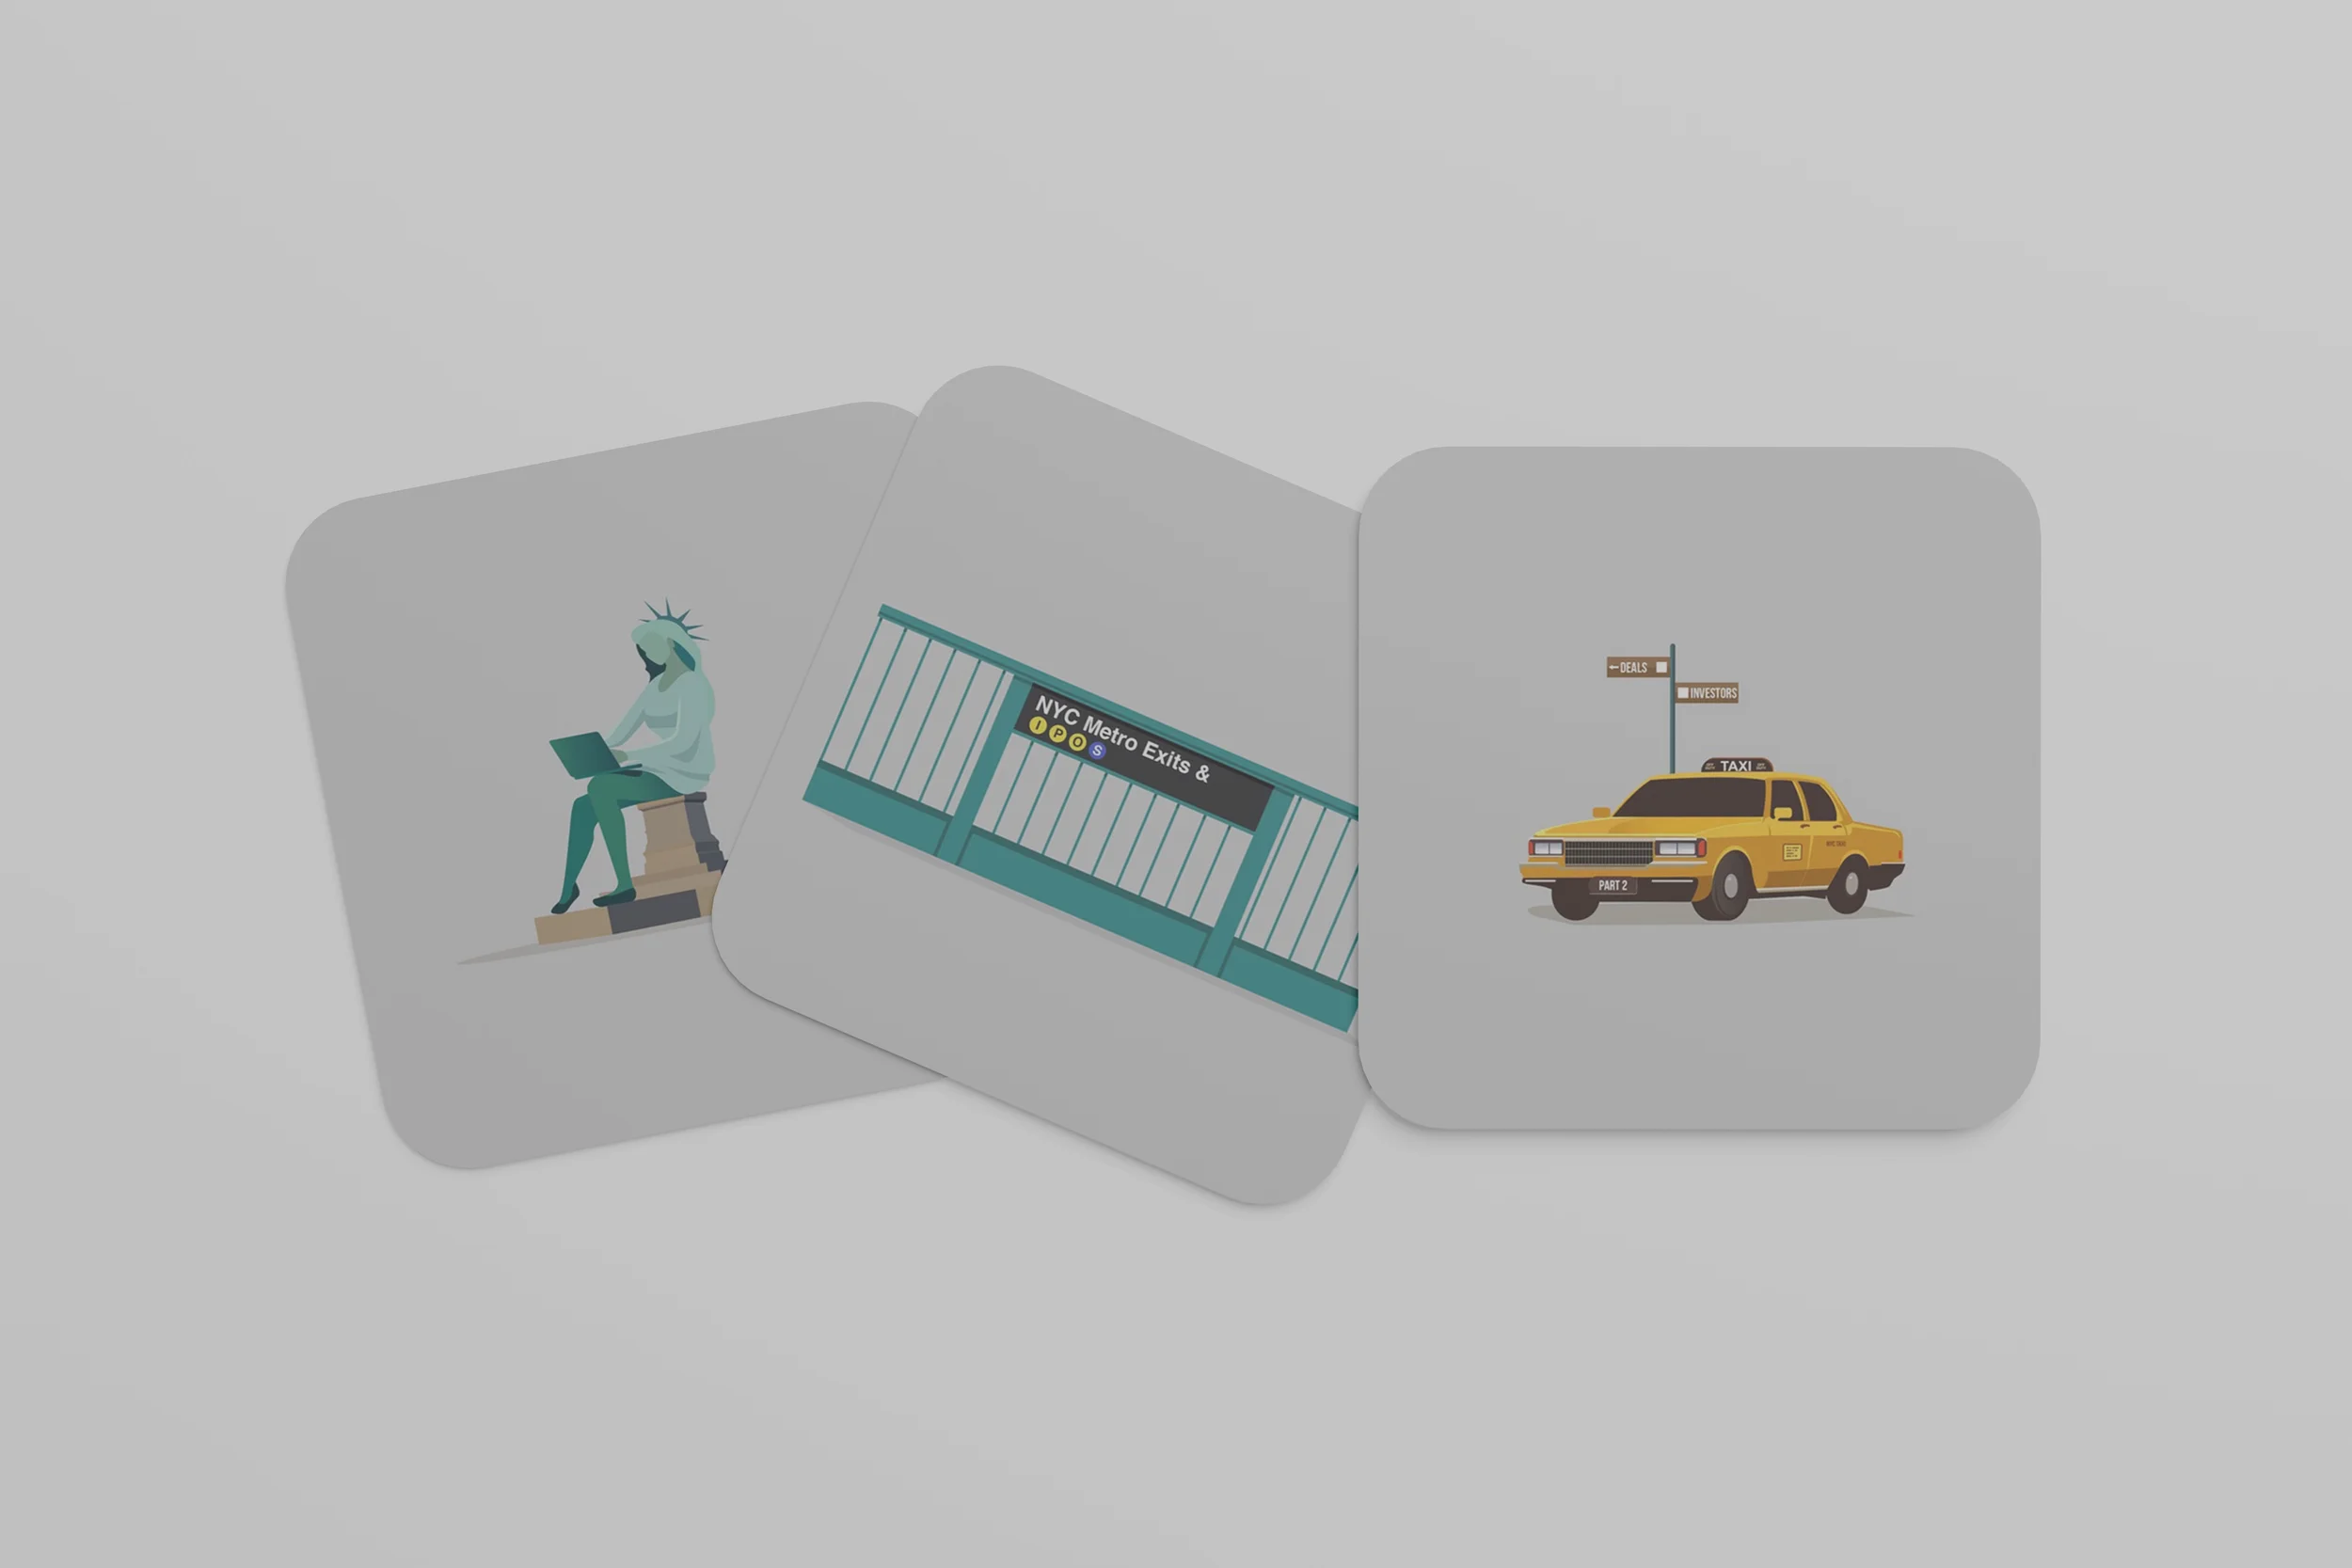
Illustrations
Cover design for reports.
A consistent publishing of a New Yorker-style cartoon.
Juxtaposition of culture and business sentiment.
Custom Reports
This was a main area of my focus, as being able to step into another brand’s shoes allowed me to be the proxy-design resource for teams that did not have that tool perhaps in-house.
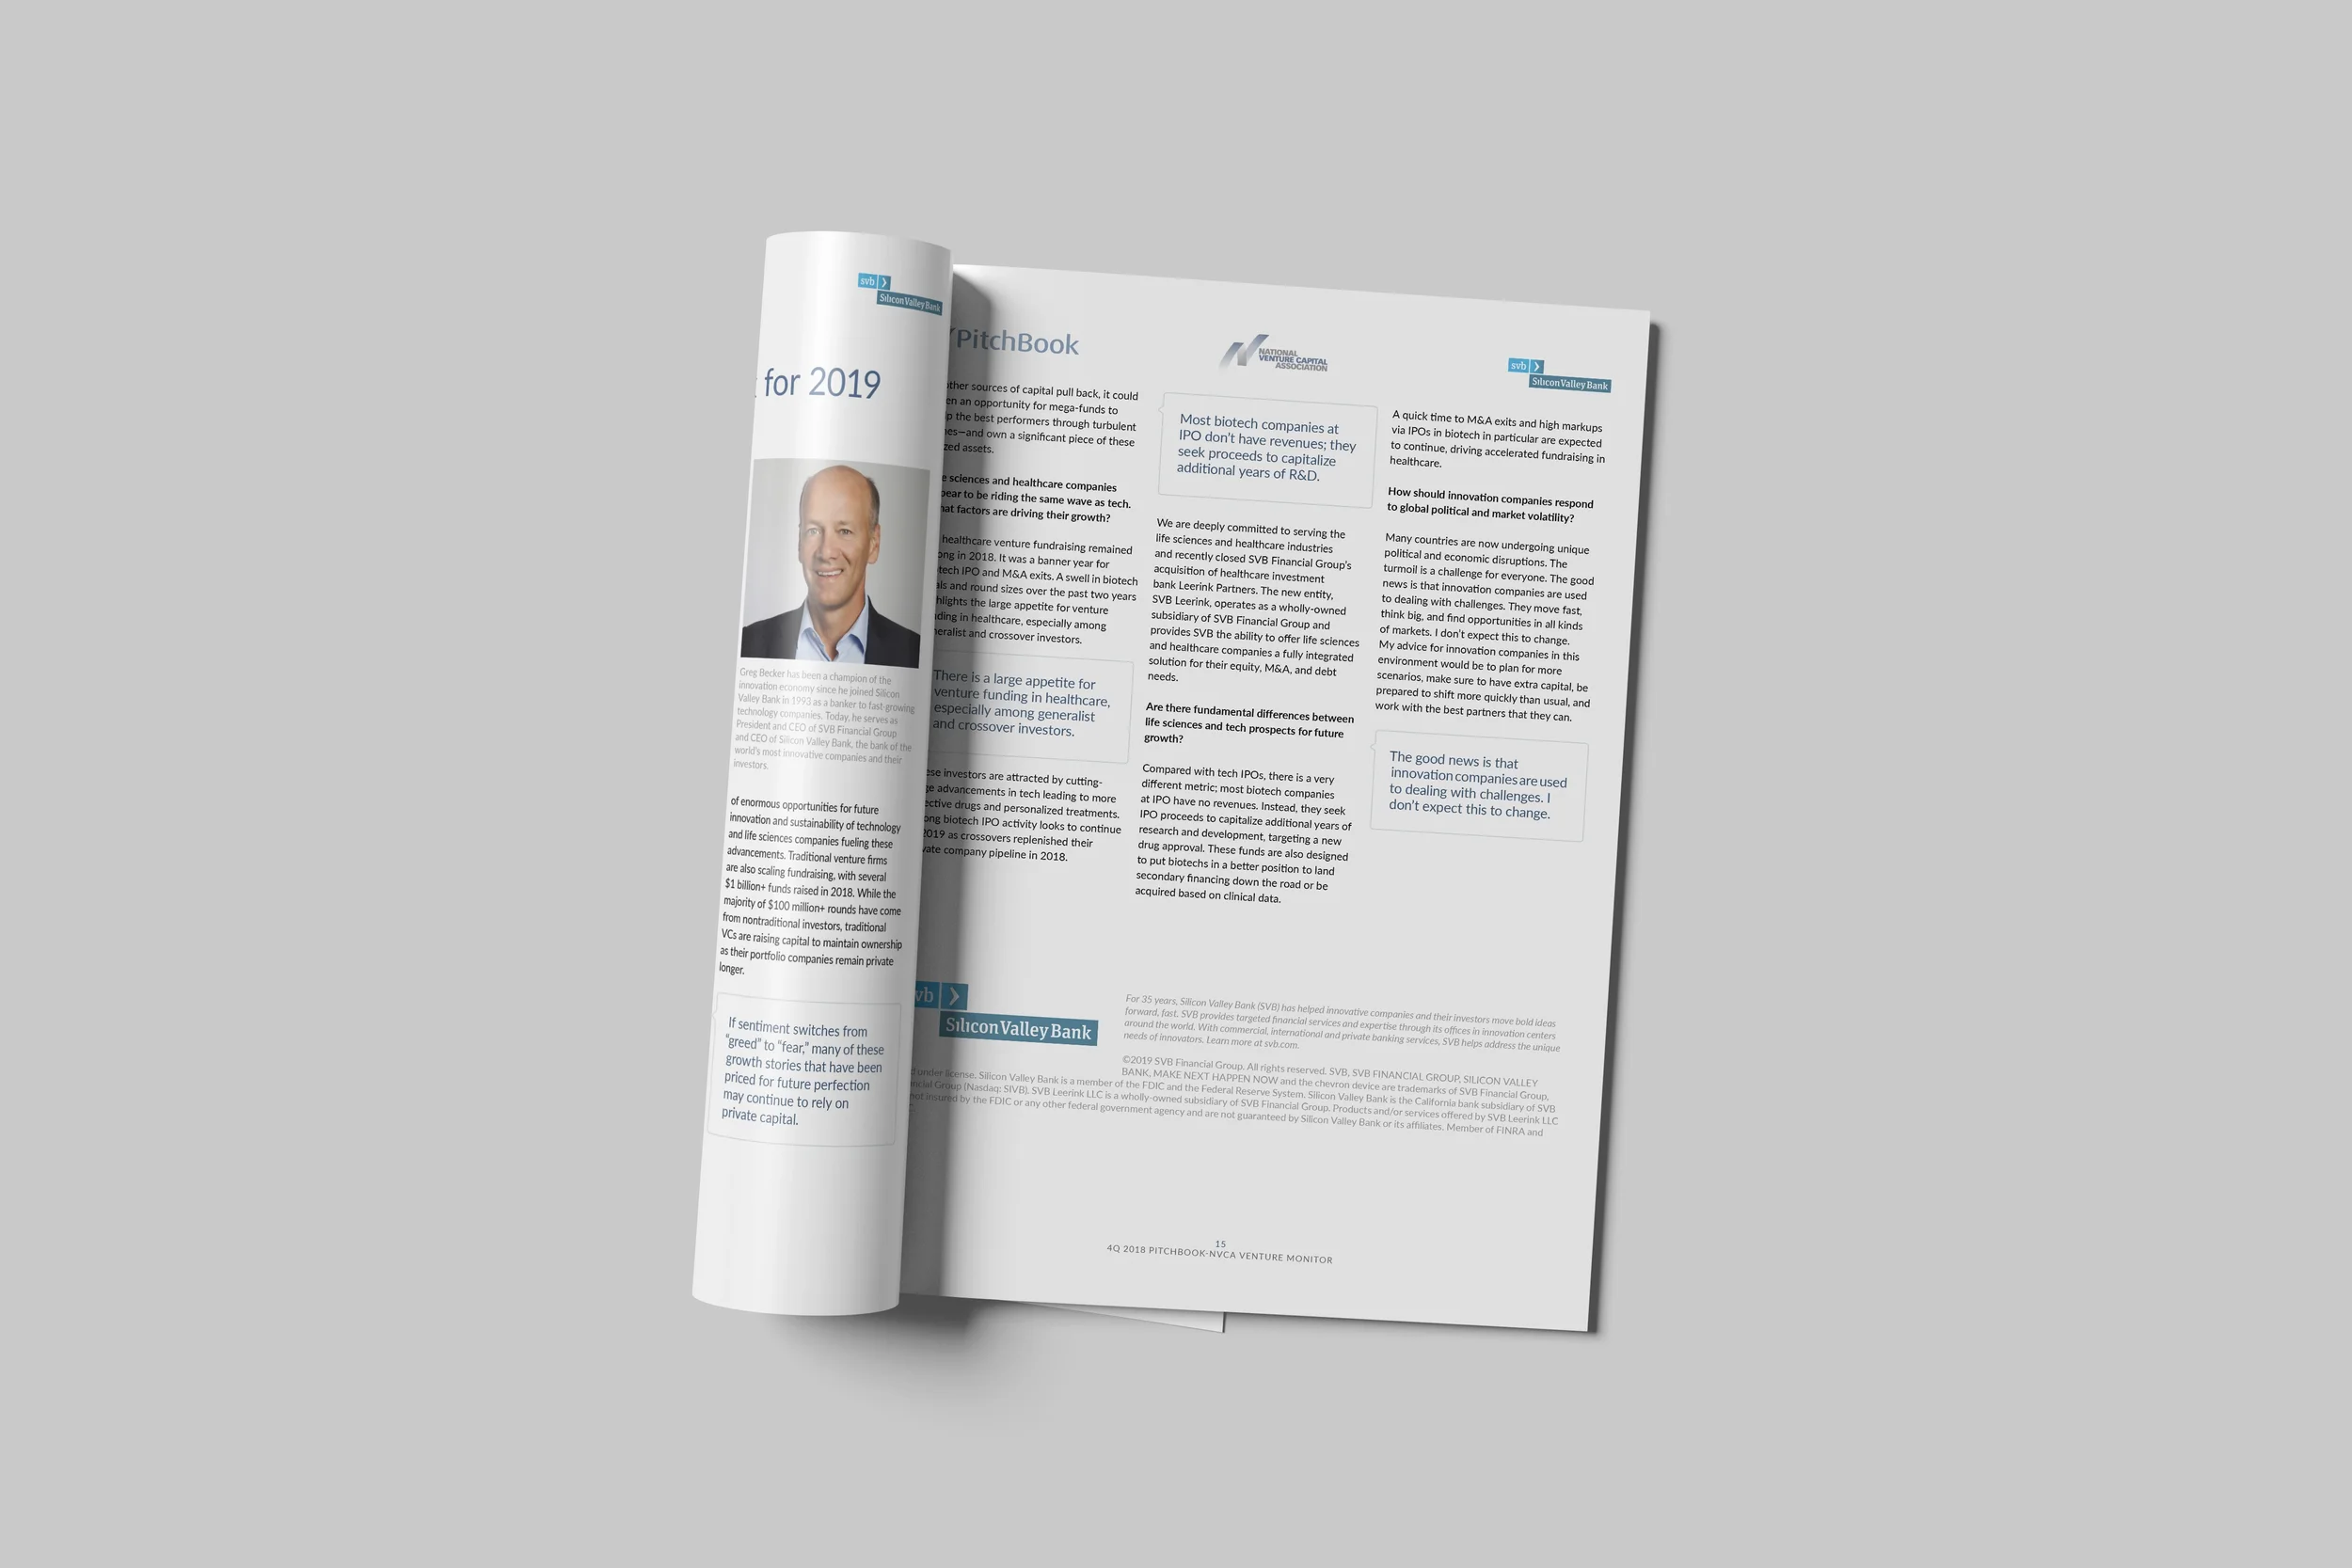
I was lucky enough to be trusted with many legacy brand’s reporting needs, and delivered their content as if their brand was my own.
The work involved was merely acting as an extension of their creative departments, remaining in-house at PitchBook since we were the main data provider.

Designing financial information is the ultimate test of graphic design because there is nowhere to hide.
The numbers must be right, the story must be clear, and the layout has to earn trust in seconds. One bad chart or confusing label can sink a decision worth millions. Simple, honest, and precise, with zero room for fluff.